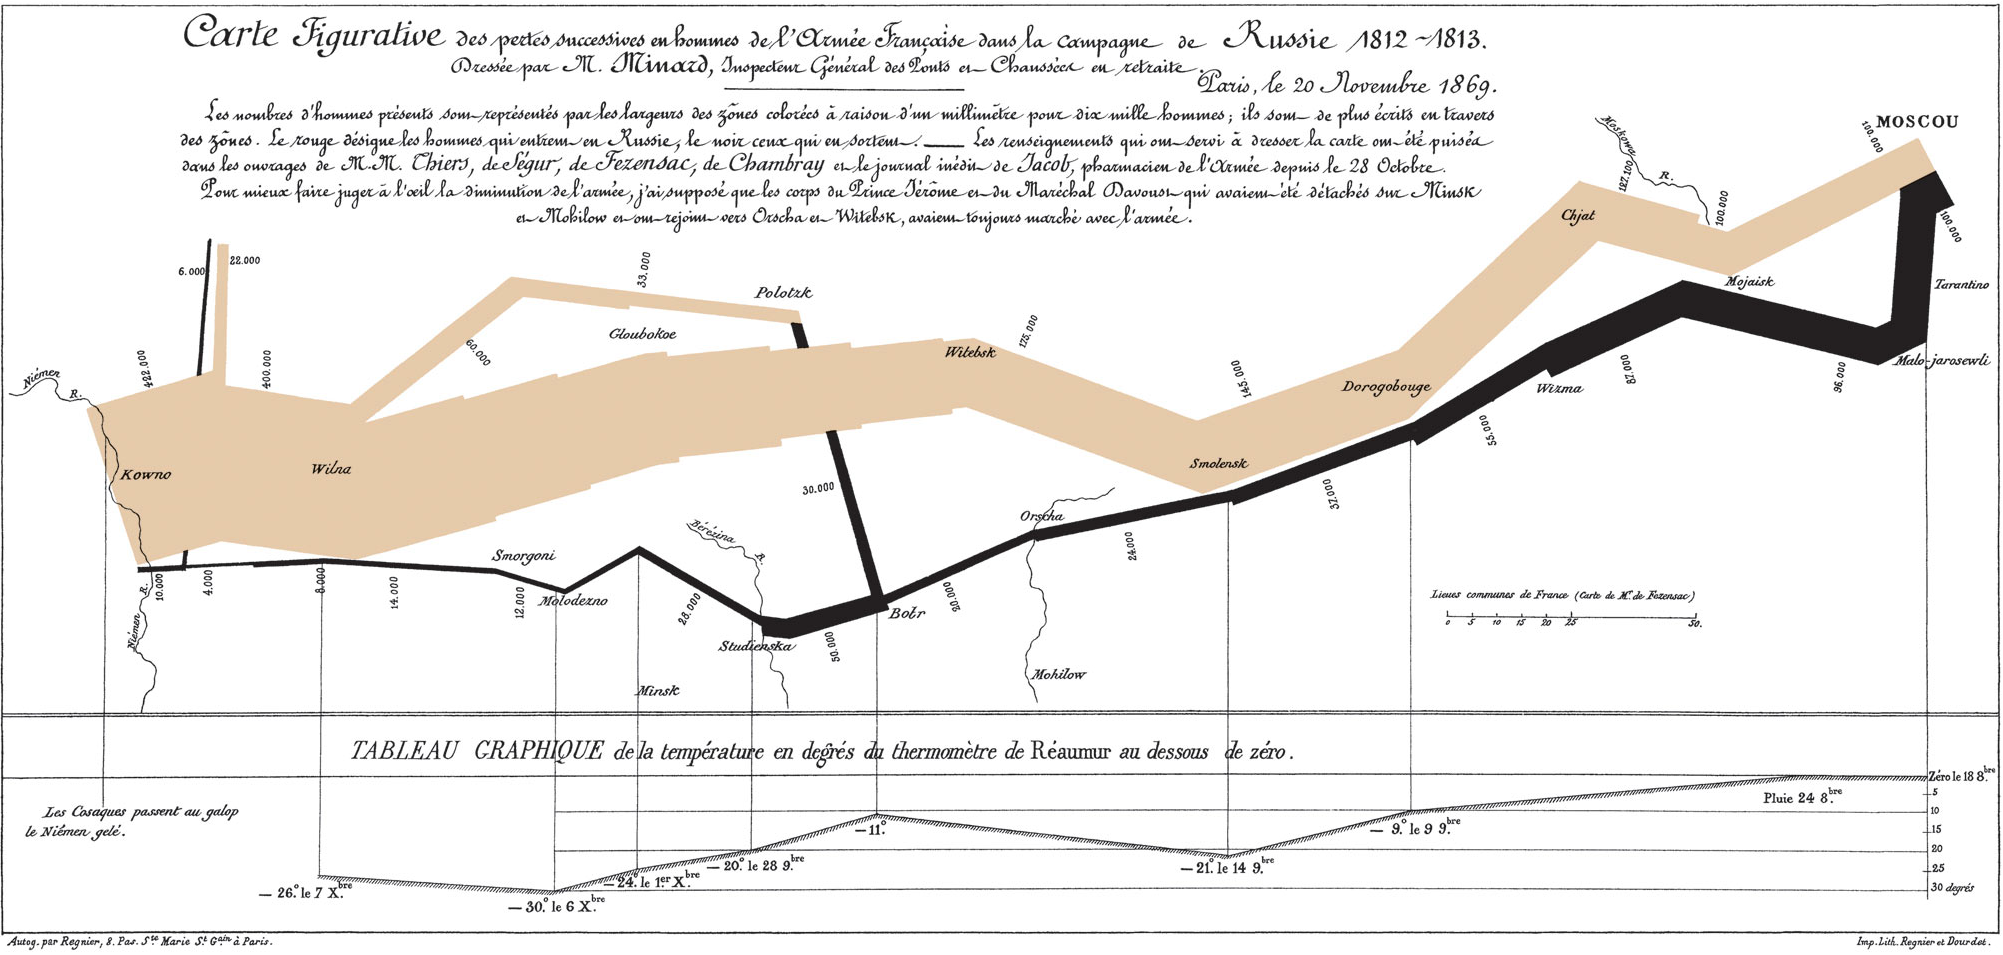
Today we dove into an exploration of visual data, everything from photographs to graphs and charts to mapping making with QGIS. We opened class with an interesting discussion of how data can be represented in various charts and in particular combining variables to communicate correlations. Charles Minard’s graphing of Napoleon’s march across Europe was held up as an an evocative example of a graph which communicates a lot of data including time and spatial relationships.
Visual graphics including photographs can effectively communicate information about a place and activities. We explored a paper written by Dr. John Gaber concerning the use of photography in planning activities. Photographs can be a double-edged sword, great at showing spatial relationships and qualitative data but could be misused if trying to show quantitative data. As part of this discussion we examined a study of several planning journals to catalogue the types of imagery on the covers to see if there was any type of trends which could be discerned over a multi-decade examination.
Lastly, we explored an open source GIS platform (QGIS) as a method to create map products for planning purposes. We added several layers to show Greenville boundaries, parcels, parks, and zoning.
Overall this class way very illuminative about various visual communicative methodologies and what data is best suited to various visual representation methods.